
Thermal analysis
3-37-22 Kodama, Nishi-ku, Nagoya-City 451-0066 Japan
Tel:052-521-1171ü@Fax:052-521-1180
![]()
3-37-22 Kodama, Nishi-ku, Nagoya-City 451-0066 Japan
Tel:052-521-1171ü@Fax:052-521-1180
![]()

A conventional method of melt quality evaluation was to make test pieces needing a considerable amount of labor and time. Melt thermal analysis has completely eliminated such extra work.
Analysis results and suggestions for processing are given within five to seven minutes after sample pouring.
Full automatic analysis after pouring ,and hence, no individual bias.
Data is obtained of the above characteristic points.
Temperature change from the start to the end of solidification of an aluminum alloy is converted to digital data and a cooling curve is drawn.
* Characteristic points are indicated in the cooling curve shown.
From the primary and eutectic temperature and solidification time, various properties are evaluated: secondary dendrite arm spacing (DAS), Si%, eutectic Si refinement, alloy purity, and crystal size.
* For the characteristic points and their significance, refer to the section on “Principle of cooling curve and thermal analysis”.
Dendrite arm spacing (DAS) can be evaluated from solidification rate.
Effect of refiner is evaluated.
Si% can be monitored.
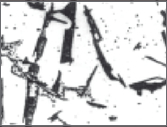
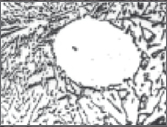
The photos below show structure refinement by Sr addition as compared with the original one in the left.
| original melt (without treatment) |
melt after treatment |
|---|---|
 |
 |
| withoutü@treatment | treatment |
Melt treatment and changed structure are reflected on the cooling curve where positions of primary temperature and eutectic temperature are changed from the original melt. Eutectic temperature is lowered in relation to the structural change.
| original melt (without treatment) |
melt after treatment |
|---|---|
 |
|
The relationship between structure formation and cooling curve is evident from the above facts.
Shown below is a cooling curve of an alloy at an assumed concentration in the Al-Si phase diagram. Primary undercooling temperature and eutectic undercooling temperature in the cooling curve can be used in calculating Si% in relation to the phase diagram. Often in measuring a real melt primary, undercooling temperature and eutectic undercooling temperature appear as in this example.
ALT-I has a high resolution of thermal analysis assisted by the use of the specific "Al cup".
The new thermal analysis accurately determines the characteristics of your melt.

![]()

ALT-I is the product of Nakayama Co.,Ltd..
![]()